See Your Entire Portfolio at a Glance
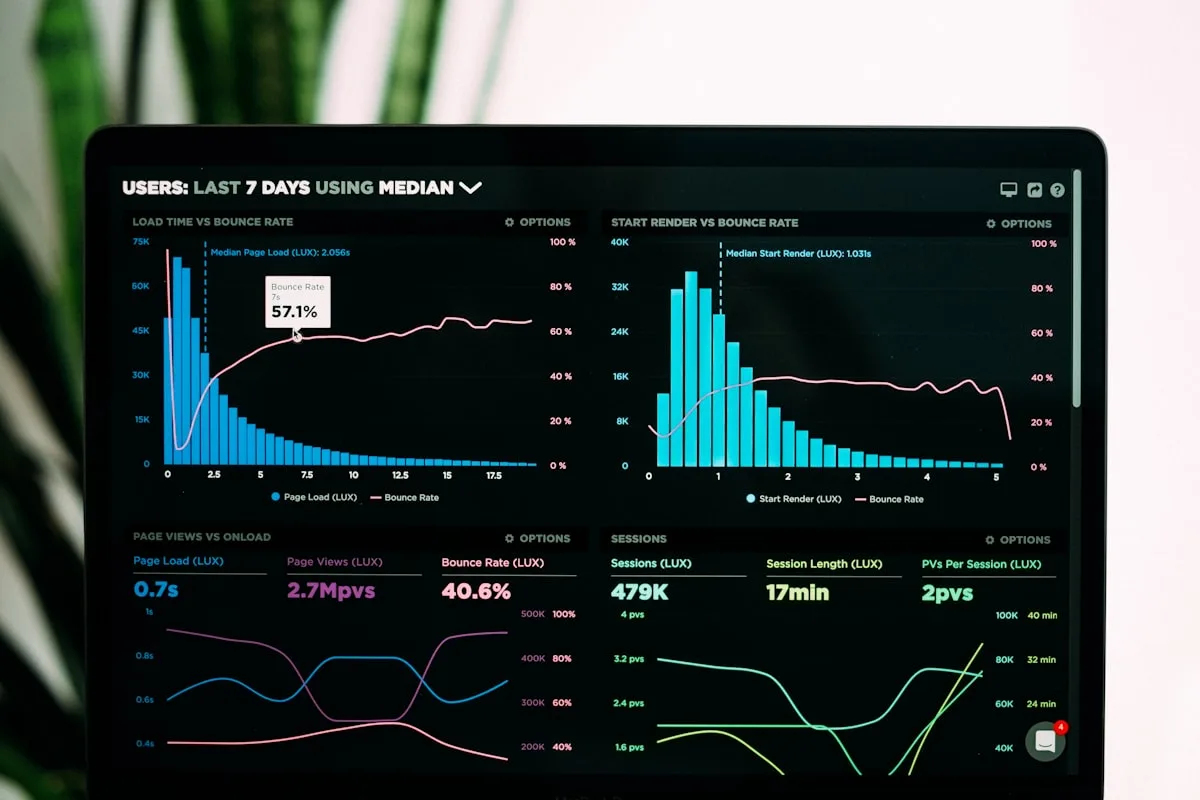
Real-time dashboards and customizable reports give you complete visibility into occupancy, revenue, expenses, and performance across every property.

Dashboard & Reporting
What's included
Operations Dashboard
Today's check-ins, check-outs, tasks, and messages — everything you need to start your day.
Learn more →Property Overview
Per-resource performance metrics, upcoming bookings, maintenance status, and availability calendar.
Learn more →Revenue Analytics
Track income by resource, platform, and time period. Identify your best performers and growth opportunities.
Learn more →Mobile Friendly
Your full dashboard accessible from any device. Check on your business from anywhere.
Learn more →QR Checklists for Staff
Pin up a QR code at each property and your cleaning or maintenance team scans it to get the day's checklist — no email, no app, no login.
Learn more →Why it matters
Make data-driven decisions with confidence
Real-Time Dashboards
Monitor occupancy, revenue, average daily rate and booking pace across your portfolio in real time.
Revenue Analytics
Break down revenue by property, source, period and currency to see your strongest performers.
Saved & Standard Reports
Run standard reports or save your own configurations, and export any view to CSV or PDF.
Scheduled Report Subscriptions
Have reports generated and emailed to you or your team on a regular schedule.
AI Flow Custom Reports
Ask a plain-language question about your data and AI Flow builds the report for you.
Owner Statements
Produce clear owner statements for the property management companies and owners you report to.
How it works
From raw data to actionable insights
Connect Your Data
Airflow automatically aggregates booking, financial, and operational data from every connected platform into your reporting engine.
Explore Dashboards
Use pre-built dashboards for portfolio overview, revenue breakdown, occupancy trends, and channel performance, or build your own.
Share & Act
Export reports AND schedule automatic delivery to owners and stakeholders, and use insights to optimize your strategy.
Data at a glance
Insights that drive decisions


Overview
Without clear visibility into your portfolio performance, you are making decisions in the dark. Airflow dashboards and reports bring together your booking and accounting data into a single source of truth. Whether you manage five properties or five hundred, you get the same level of insight. Real-time dashboards update as bookings come in, showing occupancy, revenue, average daily rate and booking pace. Drill into any property, source, period or currency to understand exactly what is driving your results, and look ahead with the forward booking pipeline.
Key Details
Run standard reports or save your own configurations, and set up scheduled report subscriptions so reports are generated and emailed on a regular schedule. For a quick answer, AI Flow custom reports let you ask a plain-language question about your data. Owner statements are designed for property management companies that need to give owners clear, professional financial updates. Export any report or dashboard view to CSV or PDF. Per-domain website analytics show traffic, top pages, countries and referrers for your booking site.
FAQ
Frequently asked questions
What metrics can I track on the dashboard?
Airflow dashboards cover occupancy, revenue, average daily rate, booking pace, source mix and the forward booking pipeline, broken down by property, period and currency.
Can I create reports for individual property owners?
Yes. You can produce owner statements for individual owners covering only their properties, and set up scheduled report subscriptions to email reports on a regular schedule.
Does Airflow support data export?
All reports and dashboard views can be exported as PDF or CSV. AI Flow custom reports also let you ask a plain-language question and get the data you need.
How far back does historical data go?
Airflow keeps your booking and financial history from the day you connect your accounts. There is no limit on historical data storage.
Can I compare performance across time periods?
Yes. Reports and dashboards support date-range comparison, so you can measure year-on-year growth, seasonal trends and month-on-month changes.
Explore more
Other feature areas
Guides & insights
From the blog

Airbnb Payouts Don't Match Your Invoices — Here's Why
The guest paid €1,200. After Airbnb's ~15% host-only fee and a currency conversion, your bank received £867. Your Xero invoice says something else entirely. Here's what's happening — and how to fix it.
Read article →
Why None of Your OTA Payouts Match Your Invoices
Airbnb, Booking.com and VRBO each net fees and commission differently, so OTA payouts rarely match your invoices. Here is why, and how to reconcile cleanly.
Read article →
Xero + Short-Term Rentals: The Setup Nobody Teaches You
Xero is powerful accounting software. But setting it up for short-term rental income — with multiple properties, platforms, currencies, and fee structures — is harder than it should be. Here's the right way.
Read article →Ready to see the full picture?
Start your free trial today. No credit card required.
Start free trial